Tracing Tutorial with Grafana Tempo
This walkthrough shows how to create a local cluster and deploy a number of components, including an ingress-nginx ingress controller, Grafana and the Tempo backend to store traces.
On the prepared cluster we will deploy Kyverno with tracing enabled and a couple of policies.
Finally we will exercise the Kyverno webhooks by creating a Pod, then we will use Grafana to find and examine the corresponding trace.
Please note that this walkthrough uses kind to create a local cluster with a specific label on the control plane node. This is necessary as we are using an ingress-nginx deployment specifically crafted to work with kind. All other components setup should not be kind specific but may require different configuration depending on the target cluster.
Cluster Setup
In this first step we are going to create a local cluster using kind.
The created cluster will have two nodes, one master node and one worker node. Note that the master node maps host ports 80 and 443 to the container node. If those ports are already in use they can be changed by editing the hostPort stanza in the config manifest below.
To create the local cluster, run the following command:
 1kind create cluster --config - <<EOF
 2kind: Cluster
 3apiVersion: kind.x-k8s.io/v1alpha4
 4nodes:
 5  - role: control-plane
 6    kubeadmConfigPatches:
 7      - |-
 8        kind: InitConfiguration
 9        nodeRegistration:
10          kubeletExtraArgs:
11            node-labels: "ingress-ready=true"
12    extraPortMappings:
13      - containerPort: 80
14        hostPort: 80
15        protocol: TCP
16      - containerPort: 443
17        hostPort: 443
18        protocol: TCP
19  - role: worker
20EOF
Ingress NGINX Setup
In order to access Grafana from our browser, we need to deploy an ingress controller.
We are going to install ingress-nginx with the following command:
1kubectl apply -f https://raw.githubusercontent.com/kubernetes/ingress-nginx/main/deploy/static/provider/kind/deploy.yaml
2sleep 15
3kubectl wait --namespace ingress-nginx --for=condition=ready pod --selector=app.kubernetes.io/component=controller --timeout=90s
Grafana Setup
Grafana will allow us to explore, search and examine traces.
We can deploy Grafana using Helm with the following command:
 1helm install grafana --namespace monitoring --create-namespace --wait \
 2  --repo https://grafana.github.io/helm-charts grafana \
 3  --values - <<EOF
 4adminPassword: admin
 5sidecar:
 6  enableUniqueFilenames: true
 7  dashboards:
 8    enabled: true
 9    searchNamespace: ALL
10    provider:
11      foldersFromFilesStructure: true
12  datasources:
13    enabled: true
14    searchNamespace: ALL
15grafana.ini:
16  server:
17    root_url: "%(protocol)s://%(domain)s:%(http_port)s/grafana"
18    serve_from_sub_path: true
19ingress:
20  enabled: true
21  path: /grafana
22  hosts: []
23EOF
At this point Grafana should be available at http://localhost/grafana (log in with admin / admin).
Tempo Setup
Tempo is a tracing backend capable of receiving traces in OpenTelemetry format. It is developed and maintained by the Grafana team and integrates very well with it.
We can deploy Tempo using Helm with the following command:
1helm install tempo --namespace monitoring --create-namespace --wait \
2  --repo https://grafana.github.io/helm-charts tempo \
3  --values - <<EOF
4tempo:
5  searchEnabled: true
6EOF
To make Tempo available in Grafana, we need to register it as a Grafana data source:
 1kubectl apply -f - <<EOF
 2apiVersion: v1
 3kind: ConfigMap
 4metadata:
 5  labels:
 6    grafana_datasource: "1"
 7  name: tempo-datasource
 8  namespace: monitoring
 9data:
10  tempo-datasource.yaml: |-
11    apiVersion: 1
12    datasources:
13    - name: Tempo
14      type: tempo
15      access: proxy
16      url: "http://tempo.monitoring:3100"
17      version: 1
18      isDefault: true
19EOF
At this point we have a running cluster with Grafana and Tempo backend installed and we can access Grafana using an ingress controller.
Kyverno Setup
We now need to install Kyverno with tracing enabled and pointing to our Tempo backend.
We can deploy Kyverno using Helm with the following command:
 1helm install kyverno --namespace kyverno --create-namespace --wait \
 2  --repo https://kyverno.github.io/kyverno kyverno \
 3  --values - <<EOF
 4admissionController:
 5  tracing:
 6    # enable tracing
 7    enabled: true
 8    # tempo backend url
 9    address: tempo.monitoring
10    # tempo backend port for opentelemetry traces
11    port: 4317
12
13backgroundController:
14  tracing:
15    # enable tracing
16    enabled: true
17    # tempo backend url
18    address: tempo.monitoring
19    # tempo backend port for opentelemetry traces
20    port: 4317
21
22cleanupController:
23  tracing:
24    # enable tracing
25    enabled: true
26    # tempo backend url
27    address: tempo.monitoring
28    # tempo backend port for opentelemetry traces
29    port: 4317
30
31reportsController:
32  tracing:
33    # enable tracing
34    enabled: true
35    # tempo backend url
36    address: tempo.monitoring
37    # tempo backend port for opentelemetry traces
38    port: 4317
39EOF
Kyverno policies Setup
Finally we need to deploy some policies in the cluster so that Kyverno can configure admission webhooks accordingly.
We are going to deploy the kyverno-policies Helm chart (with the Baseline profile of PSS) using the following command:
1helm install kyverno-policies --namespace kyverno --create-namespace --wait \
2  --repo https://kyverno.github.io/kyverno kyverno-policies \
3  --values - <<EOF
4validationFailureAction: Enforce
5EOF
Note that we are setting validationFailureAction to Enforce because Audit-mode policies are processed asynchronously and will produce a separate trace from the main one (both traces are linked together though, but not with a parent/child relationship).
Create a Pod and observe the corresponding trace
With everything in place we can exercise the Kyverno admission webhooks by creating a Pod and locating the corresponding trace in Grafana.
Run the following command to create a Pod:
1kubectl run nginx --image=nginx
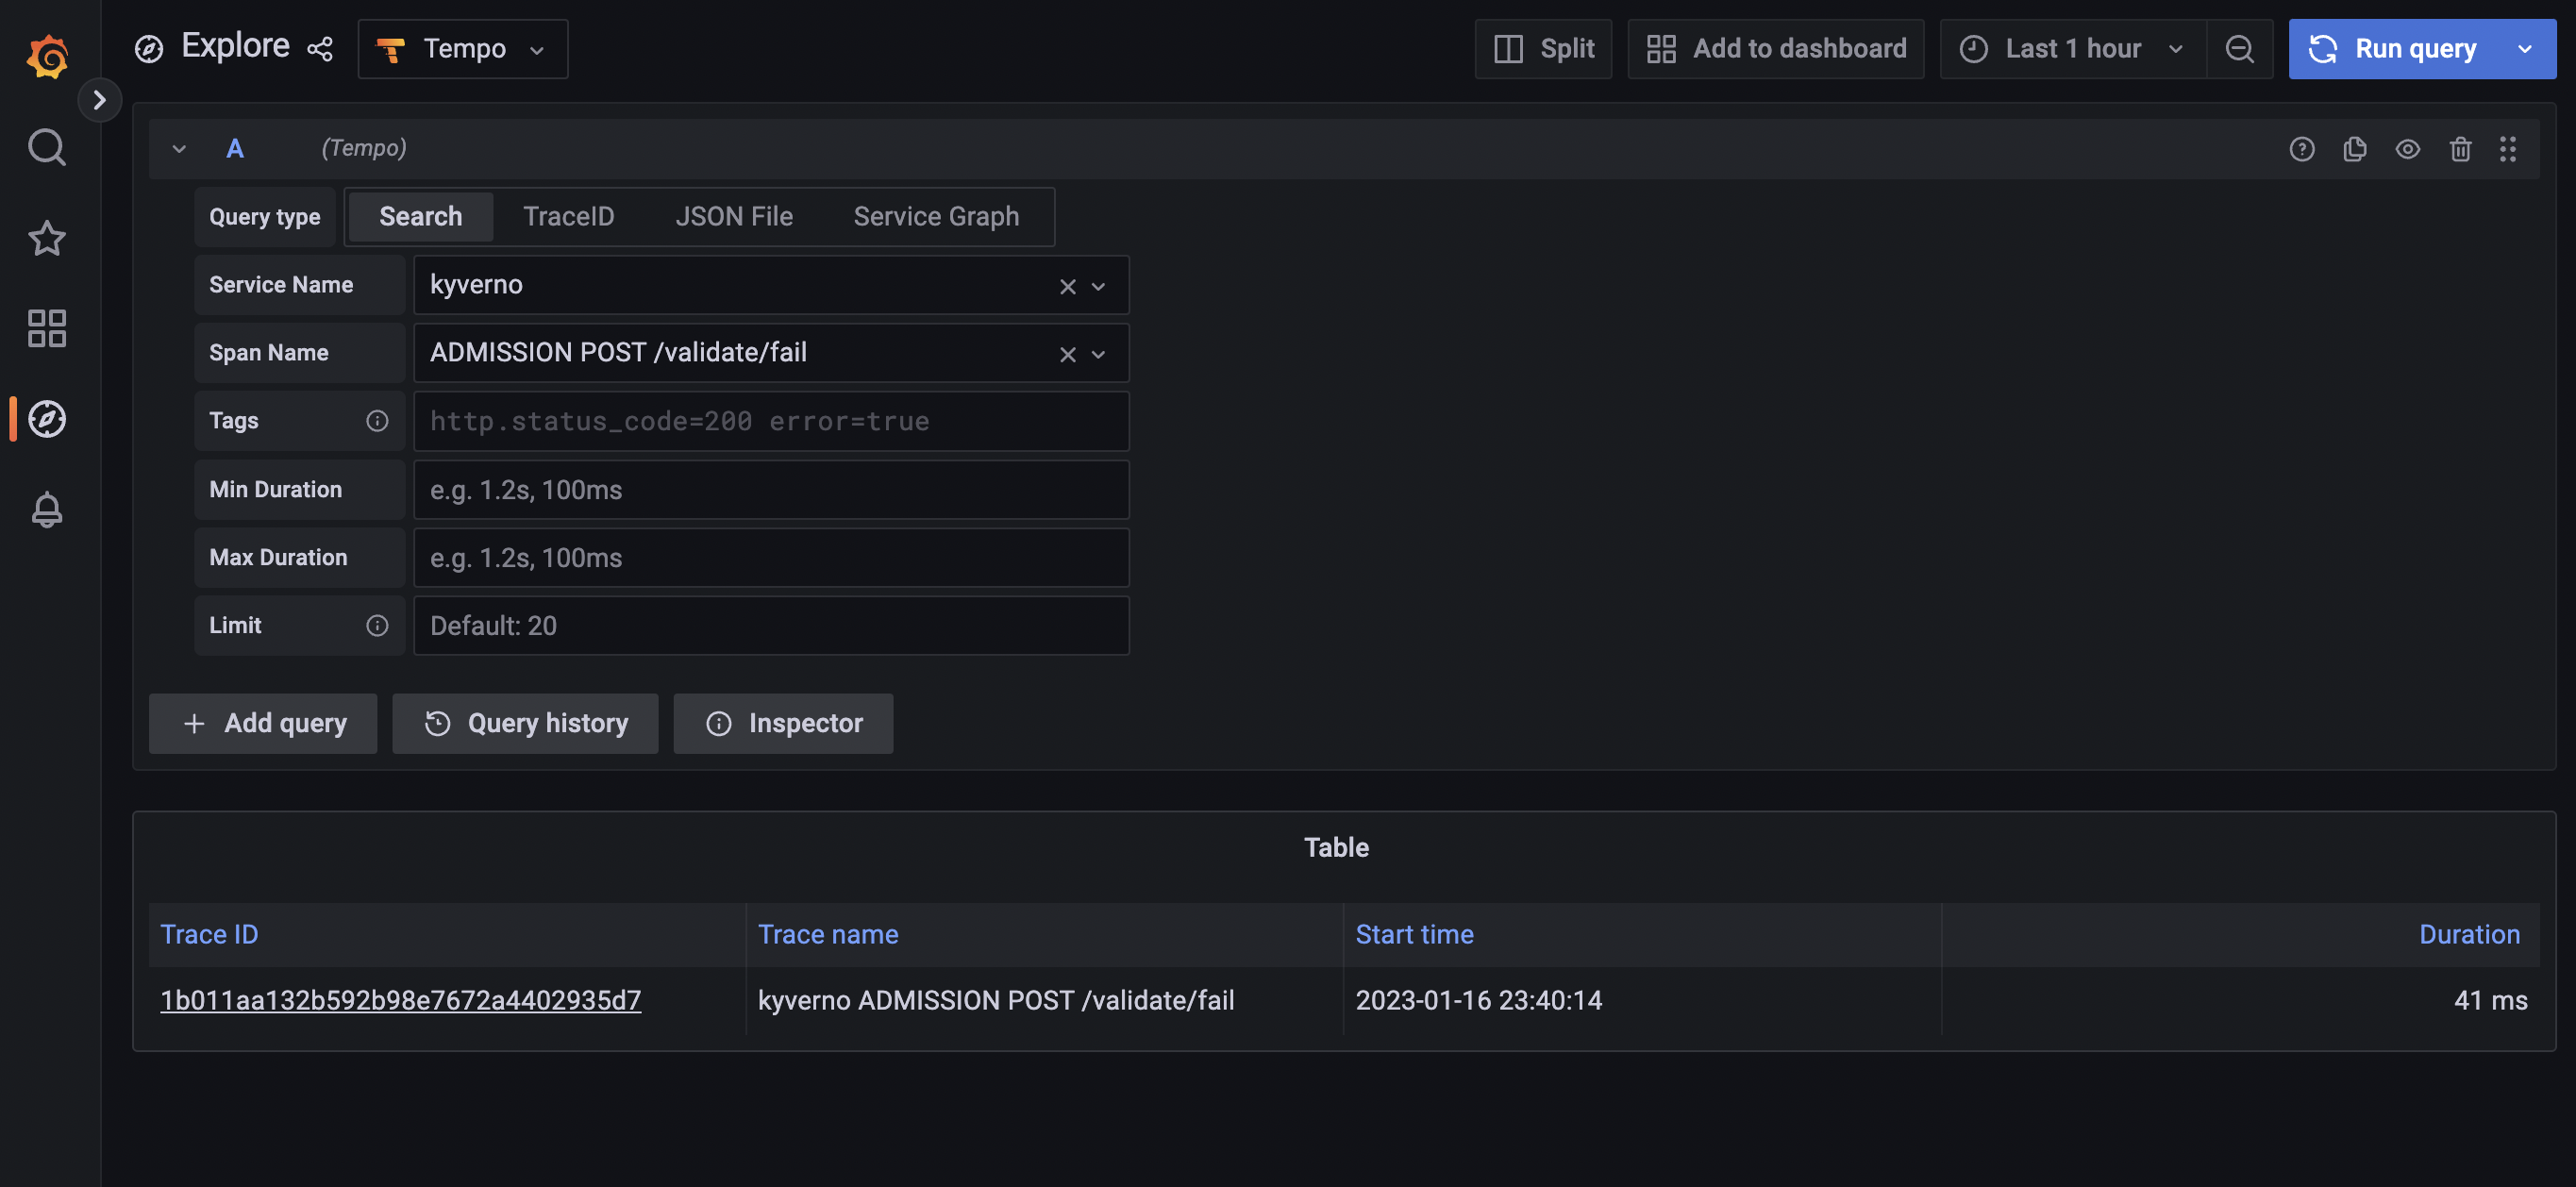
After that, navigate to the Grafana explore page, select Tempo in the top left drop down list, click on the Search tab, and search for traces with the following criteria:
- Service name:
kyverno, every trace defines a service name and all traces coming from Kyverno will use thekyvernoservice name - Span name:
ADMISSION POST /validate/fail, every span defines a span name and root spans created by Kyverno when receiving an admission request have their name computed from the http operation and path (ADMISSION <HTTP OPERATION> <HTTP PATH>. The/validate/failpath indicates that it’s a validating webhook that was configured to fail the admission request in case of error. Fail mode is the default).
The list should show the trace for the previous Pod creation request:
Clicking on the trace will take you to the trace details, showing all spans covered by the Pod admission request:
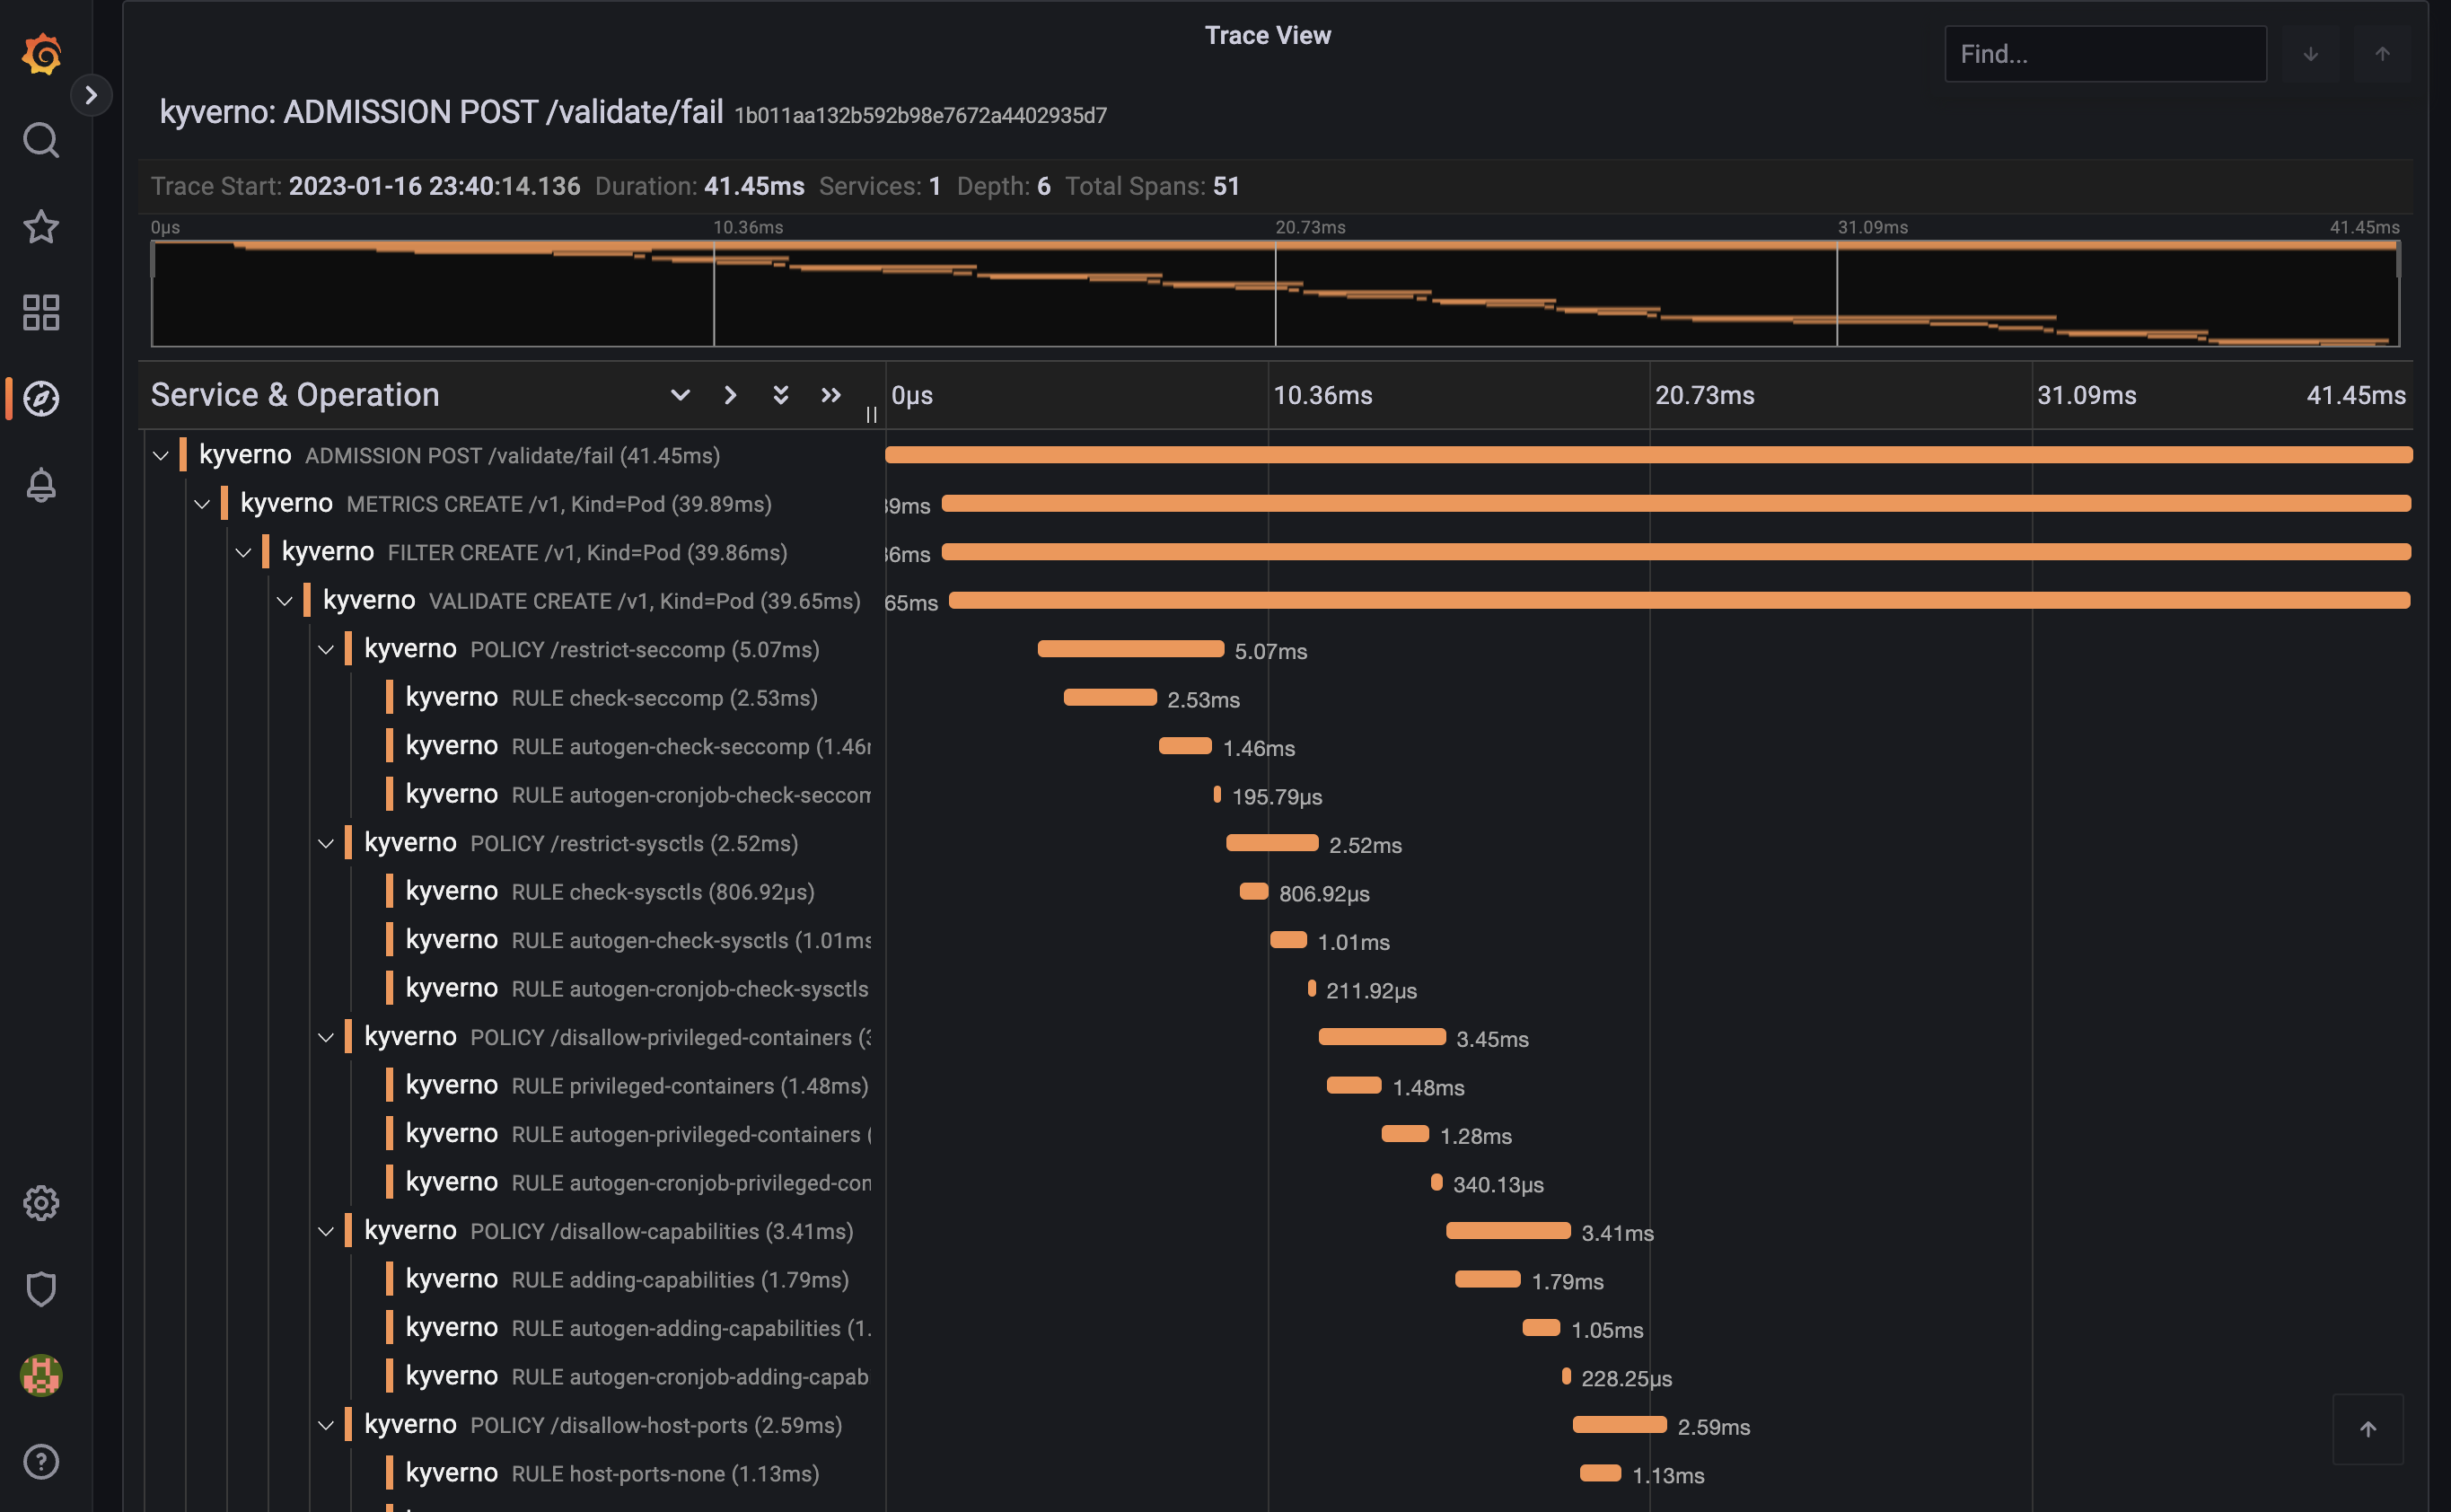
The trace shows individual spans of all the policies that were just installed, with child spans for every rule that was checked (but not necessarily evaluated). The sum of all spans equals the trace time or the entire time Kyverno spent processing the Pod admission request.
Feedback
Was this page helpful?
Glad to hear it! Please tell us how we can improve.
Sorry to hear that. Please tell us how we can improve.