Tracing
Introduction
Section titled “Introduction”Tracing is a method of tracking application requests as they are processed by the application software. When a software is instrumented it produces traces, traces are made of spans hierarchically organised to form a trace. Spans are defined by a start and end time, eventually a parent span, and a number of properties that define the span characteristics (client spans, server spans, etc…).
Tracing is not limited to a single application, as the tracing context can be transmitted on the wire it is possible to collect spans from multiple applications and reconcile them in a single trace.
In the context of Kyverno, requests are usually sent by the Kubernetes API server to the Kyverno service during the admission phase. Kyverno receives and processes admission requests according to the configured policies. Every step in the admission pipeline and during the engine policy processing will produce spans. All clients (Kubernetes client, registry client and cosign client) have also been instrumented to produce client spans and transmit the tracing context on the wire.
Trace example
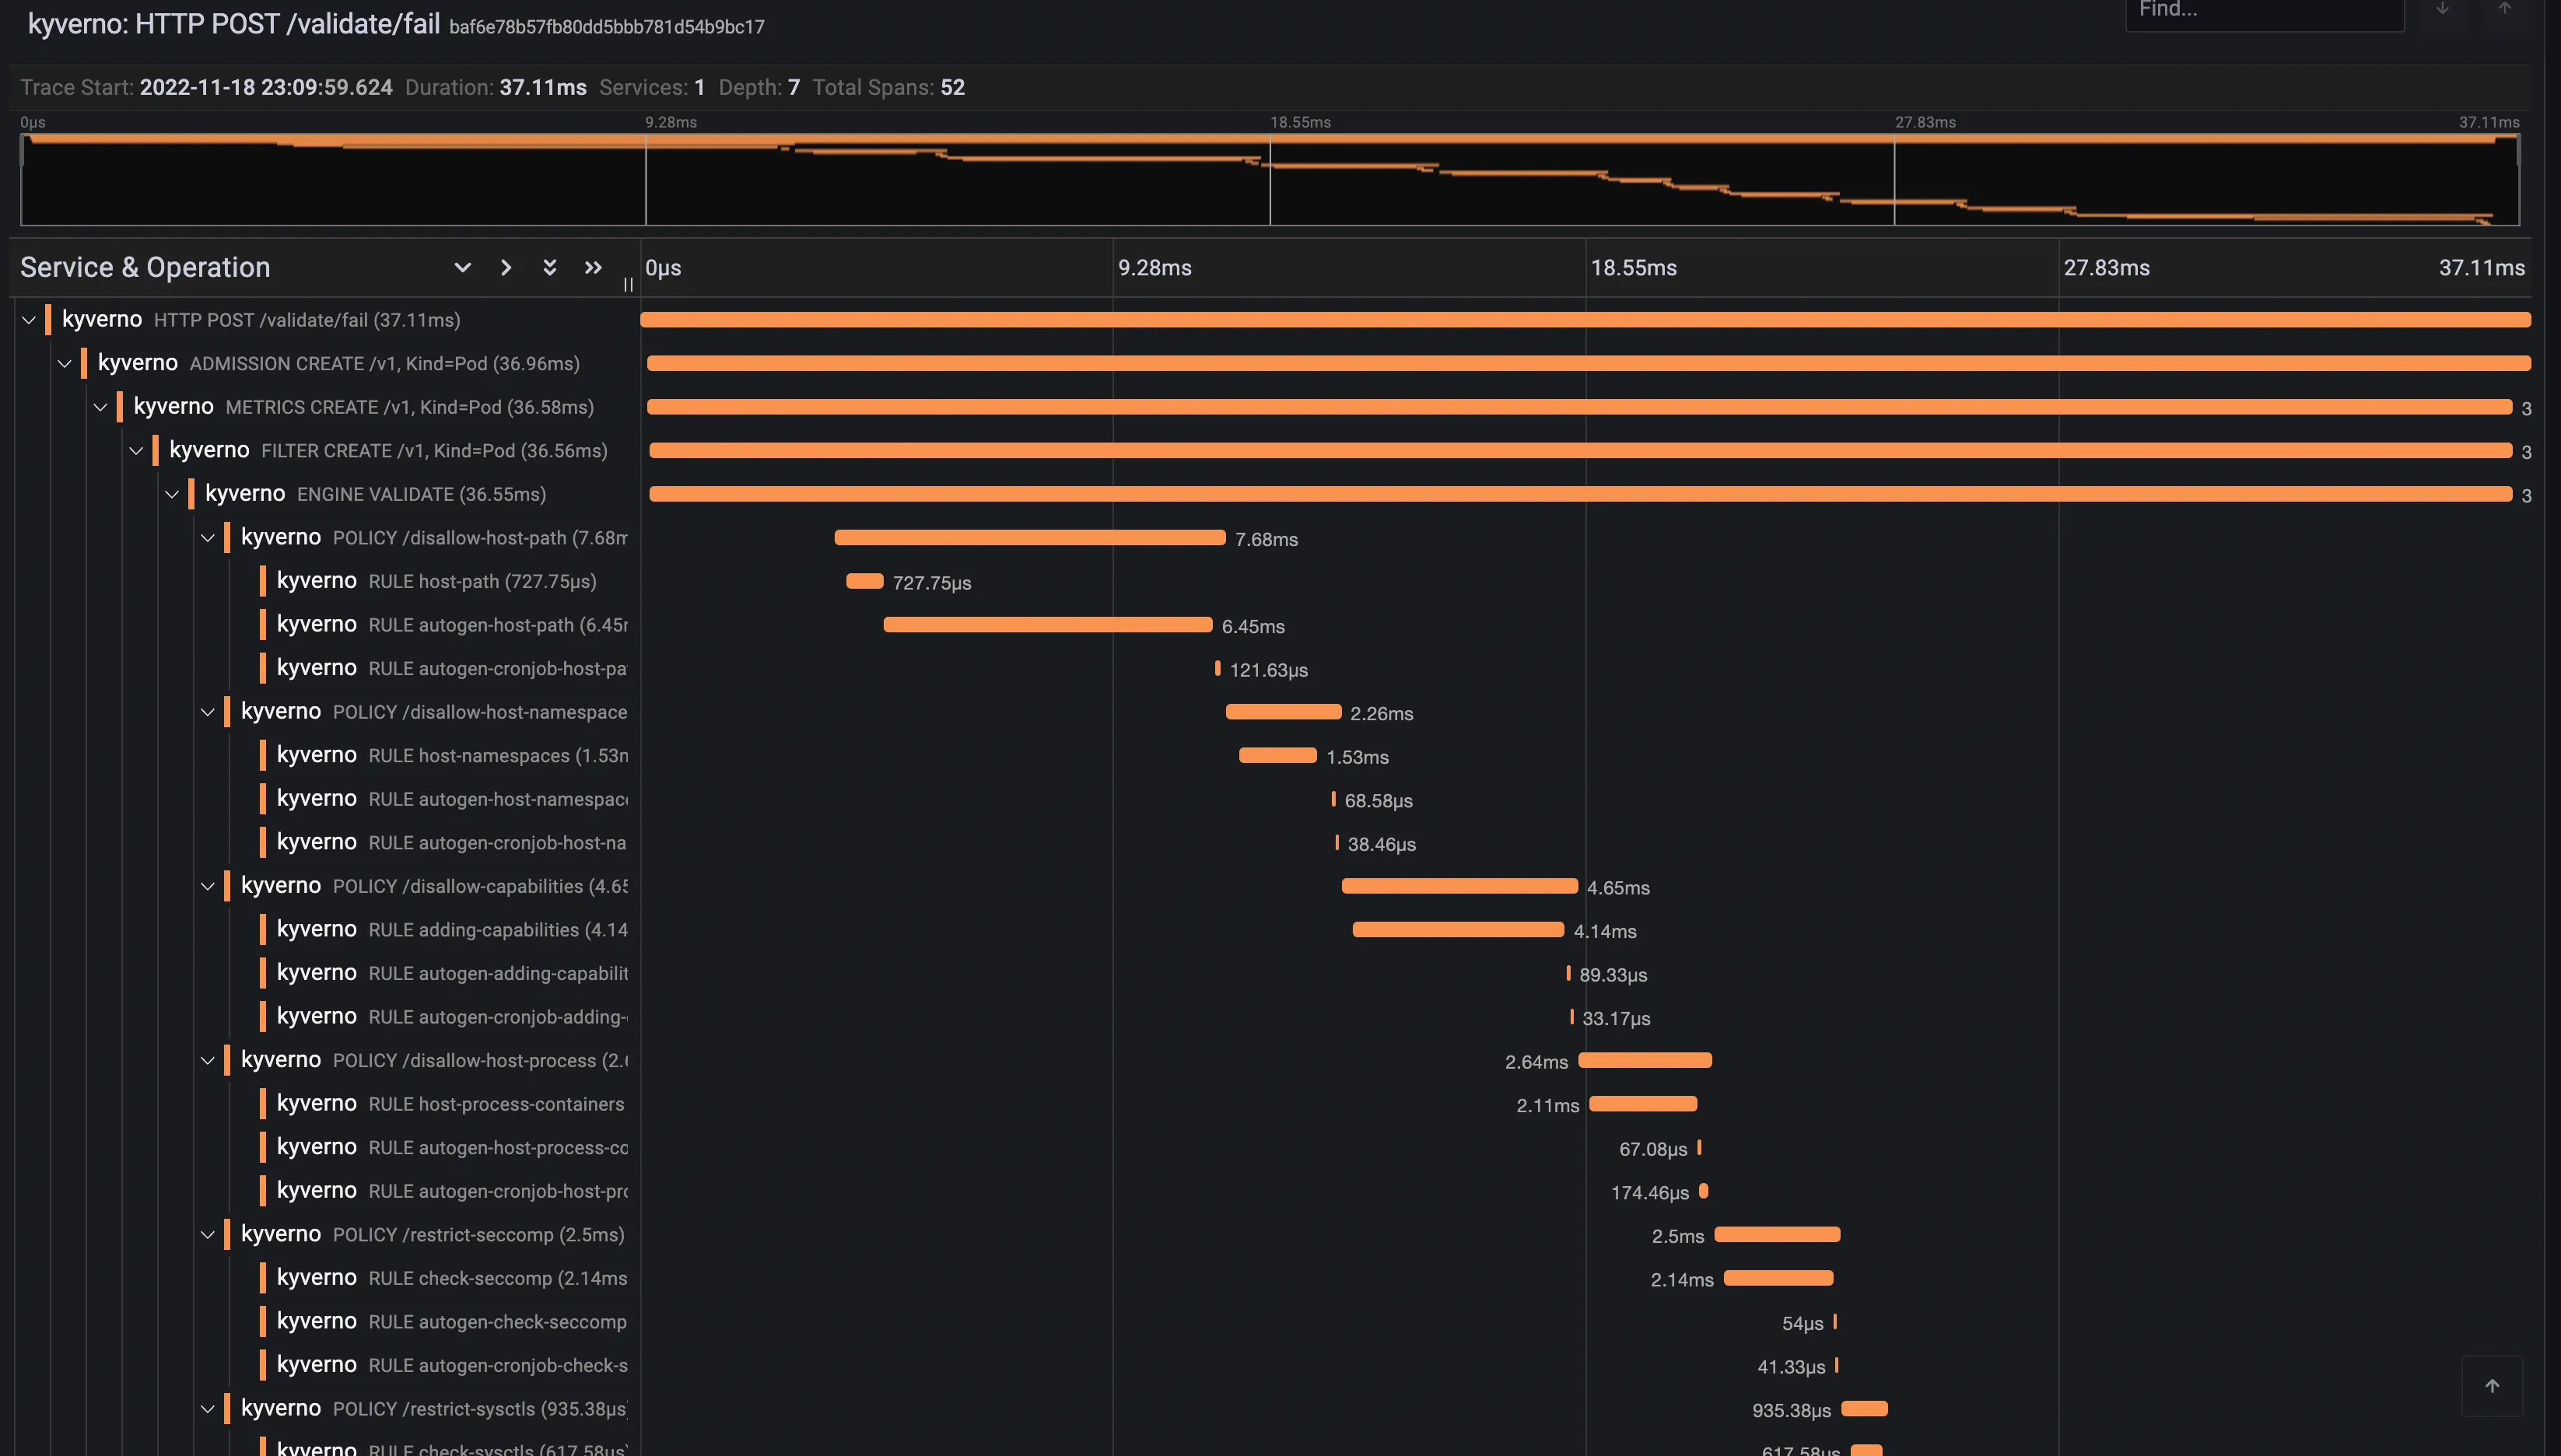
Section titled “Trace example”Below is a trace for a validating admission request.
Installation and Setup
Section titled “Installation and Setup”Tracing requires a backend where Kyverno will send traces. Kyverno uses OpenTelemetry for instrumentation and supports various backends like Jaeger, Grafana Tempo or Datadog to name a few.
When you install Kyverno via Helm, you need to set a couple of values to enable tracing.
$ values.yaml
# ...
# Enable tracing in the admission controlleradmissionController:  tracing:    # -- Enable tracing    enabled: true    # -- Traces receiver address    address: <backend url>    # -- Traces receiver port    port: 4317
# ...
# Enable tracing in the background controllerbackgroundController:  tracing:    # -- Enable tracing    enabled: true    # -- Traces receiver address    address: <backend url>    # -- Traces receiver port    port: 4317
# ...
# Enable tracing in the cleanup controllercleanupController:  tracing:    # -- Enable tracing    enabled: true    # -- Traces receiver address    address: <backend url>    # -- Traces receiver port    port: 4317
# ...
# Enable tracing in the reports controllerreportsController:  tracing:    # -- Enable tracing    enabled: true    # -- Traces receiver address    address: <backend url>    # -- Traces receiver port    port: 4317
# ...
Tracing is disabled by default and depending on the backend the associated cost can be significant.
Currently, Kyverno tracing is configured to sample all incoming requests, there’s no way to configure the tracing sampler directly in Kyverno. OpenTelemetry Collector can be used to take better sampling decision at the cost of a more advanced setup.
Tracing with Jaeger
Section titled “Tracing with Jaeger”This walkthrough shows how to create a local cluster and deploy a number of components, including an ingress-nginx ingress controller, and Jaeger to store, query and visualise traces.
On the prepared cluster we will deploy Kyverno with tracing enabled and a couple of policies.
Finally we will exercise the Kyverno webhooks by creating a Pod, then we will use Jaeger to find and examine the corresponding trace.
Please note that this walkthrough uses kind to create a local cluster with a specific label on the control plane node. This is necessary as we are using an ingress-nginx deployment specifically crafted to work with kind. All other components setup should not be kind specific but may require different configuration depending on the target cluster.
Cluster Setup
Section titled “Cluster Setup”In this first step we are going to create a local cluster using kind.
The created cluster will have two nodes, one master node and one worker node.
Note that the master node maps host ports 80 and 443 to the container node.
If those ports are already in use they can be changed by editing the hostPort stanza in the config manifest below.
To create the local cluster, run the following command:
kind create cluster --config - <<EOFkind: ClusterapiVersion: kind.x-k8s.io/v1alpha4nodes: - role: control-plane kubeadmConfigPatches: - |- kind: InitConfiguration nodeRegistration: kubeletExtraArgs: node-labels: "ingress-ready=true" extraPortMappings: - containerPort: 80 hostPort: 80 protocol: TCP - containerPort: 443 hostPort: 443 protocol: TCP - role: workerEOFIngress NGINX Setup
Section titled “Ingress NGINX Setup”In order to access Grafana from our browser, we need to deploy an ingress controller.
We are going to install ingress-nginx with the following command:
kubectl apply -f https://raw.githubusercontent.com/kubernetes/ingress-nginx/main/deploy/static/provider/kind/deploy.yamlsleep 15kubectl wait --namespace ingress-nginx --for=condition=ready pod --selector=app.kubernetes.io/component=controller --timeout=90sJaeger Setup
Section titled “Jaeger Setup”Jaeger will allow us to store, search and visualise traces.
Jaeger is made of multiple components and is capable of using multiple storage solutions like Elasticsearch or Cassandra. In this tutorial, we will deploy the all-in-one version of Jaeger and storage will be done in memory.
We can deploy Jaeger using Helm with the following command:
helm install jaeger --namespace monitoring --create-namespace --wait \ --repo https://jaegertracing.github.io/helm-charts jaeger \ --values - <<EOFstorage: type: noneprovisionDataStore: cassandra: falseagent: enabled: falsecollector: enabled: falsequery: enabled: falseallInOne: enabled: true ingress: enabled: true hosts: - localhostEOFAt this point, the Jaeger UI should be available at http://localhost.
Kyverno Setup
Section titled “Kyverno Setup”We now need to install Kyverno with tracing enabled and pointing to our Jaeger collector.
We can deploy Kyverno using Helm with the following command:
helm install kyverno --namespace kyverno --create-namespace --wait \  --repo https://kyverno.github.io/kyverno kyverno \  --values - <<EOFadmissionController:  tracing:    # enable tracing    enabled: true    # jaeger backend url    address: jaeger-collector.monitoring    # jaeger backend port for opentelemetry traces    port: 4317
backgroundController:  tracing:    # enable tracing    enabled: true    # jaeger backend url    address: jaeger-collector.monitoring    # jaeger backend port for opentelemetry traces    port: 4317
cleanupController:  tracing:    # enable tracing    enabled: true    # jaeger backend url    address: jaeger-collector.monitoring    # jaeger backend port for opentelemetry traces    port: 4317
reportsController:  tracing:    # enable tracing    enabled: true    # jaeger backend url    address: jaeger-collector.monitoring    # jaeger backend port for opentelemetry traces    port: 4317EOF
Kyverno policies Setup
Section titled “Kyverno policies Setup”Finally we need to deploy some policies in the cluster so that Kyverno can configure admission webhooks accordingly.
We are going to deploy the kyverno-policies Helm chart (with the Baseline profile of PSS) using the following command:
helm install kyverno-policies --namespace kyverno --create-namespace --wait \ --repo https://kyverno.github.io/kyverno kyverno-policies \ --values - <<EOFvalidationFailureAction: EnforceEOFNote that we are setting validationFailureAction to Enforce because Audit-mode policies are processed asynchronously and will produce a separate trace from the main one (both traces are linked together though, but not with a parent/child relationship).
Create a Pod and observe the corresponding trace
Section titled “Create a Pod and observe the corresponding trace”With everything in place we can exercise the Kyverno admission webhooks by creating a Pod and locating the corresponding trace in Jaeger.
Run the following command to create a Pod:
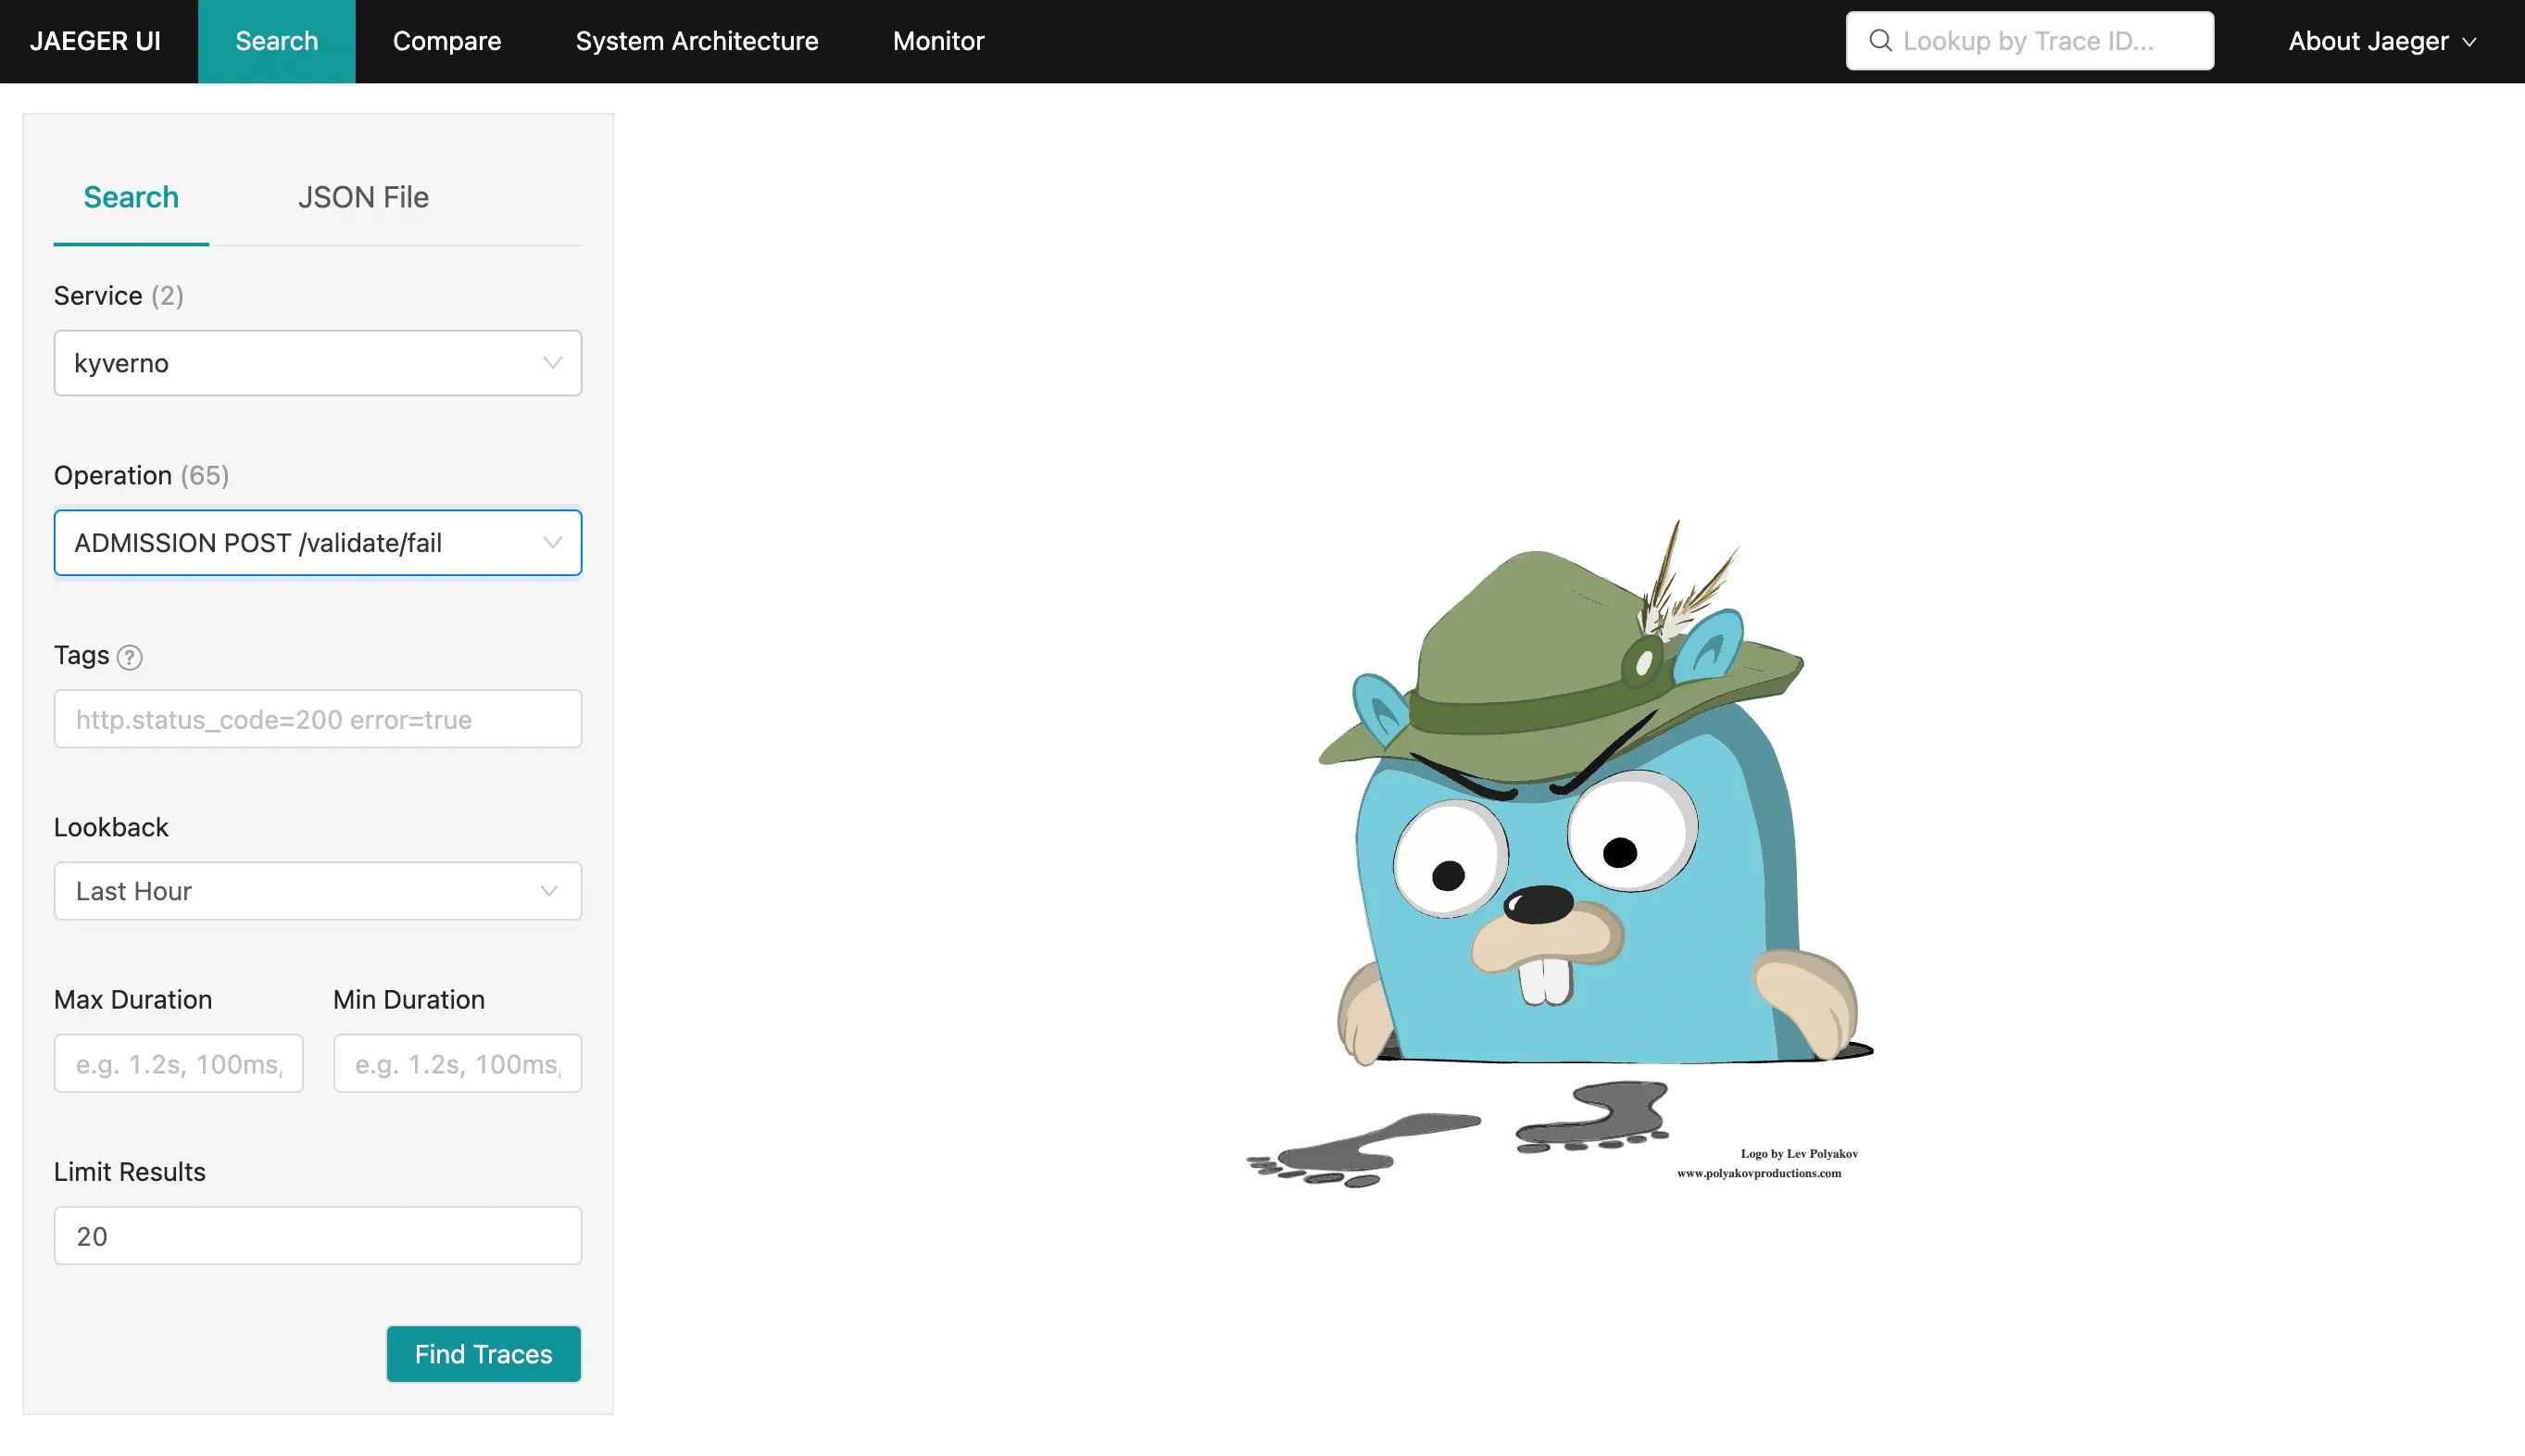
kubectl run nginx --image=nginxAfter that, navigate to the Jaeger UI and search for traces with the following criteria:
- Service:
kyverno, every trace defines a service name and all traces coming from Kyverno will use thekyvernoservice name - Operation:
ADMISSION POST /validate/fail, every span defines a span name and root spans created by Kyverno when receiving an admission request have their name computed from the http operation and path (ADMISSION <HTTP OPERATION> <HTTP PATH>. The/validate/failpath indicates that it’s a validating webhook that was configured to fail the admission request in case of error. Fail mode is the default).
The list should show the trace for the previous Pod creation request:
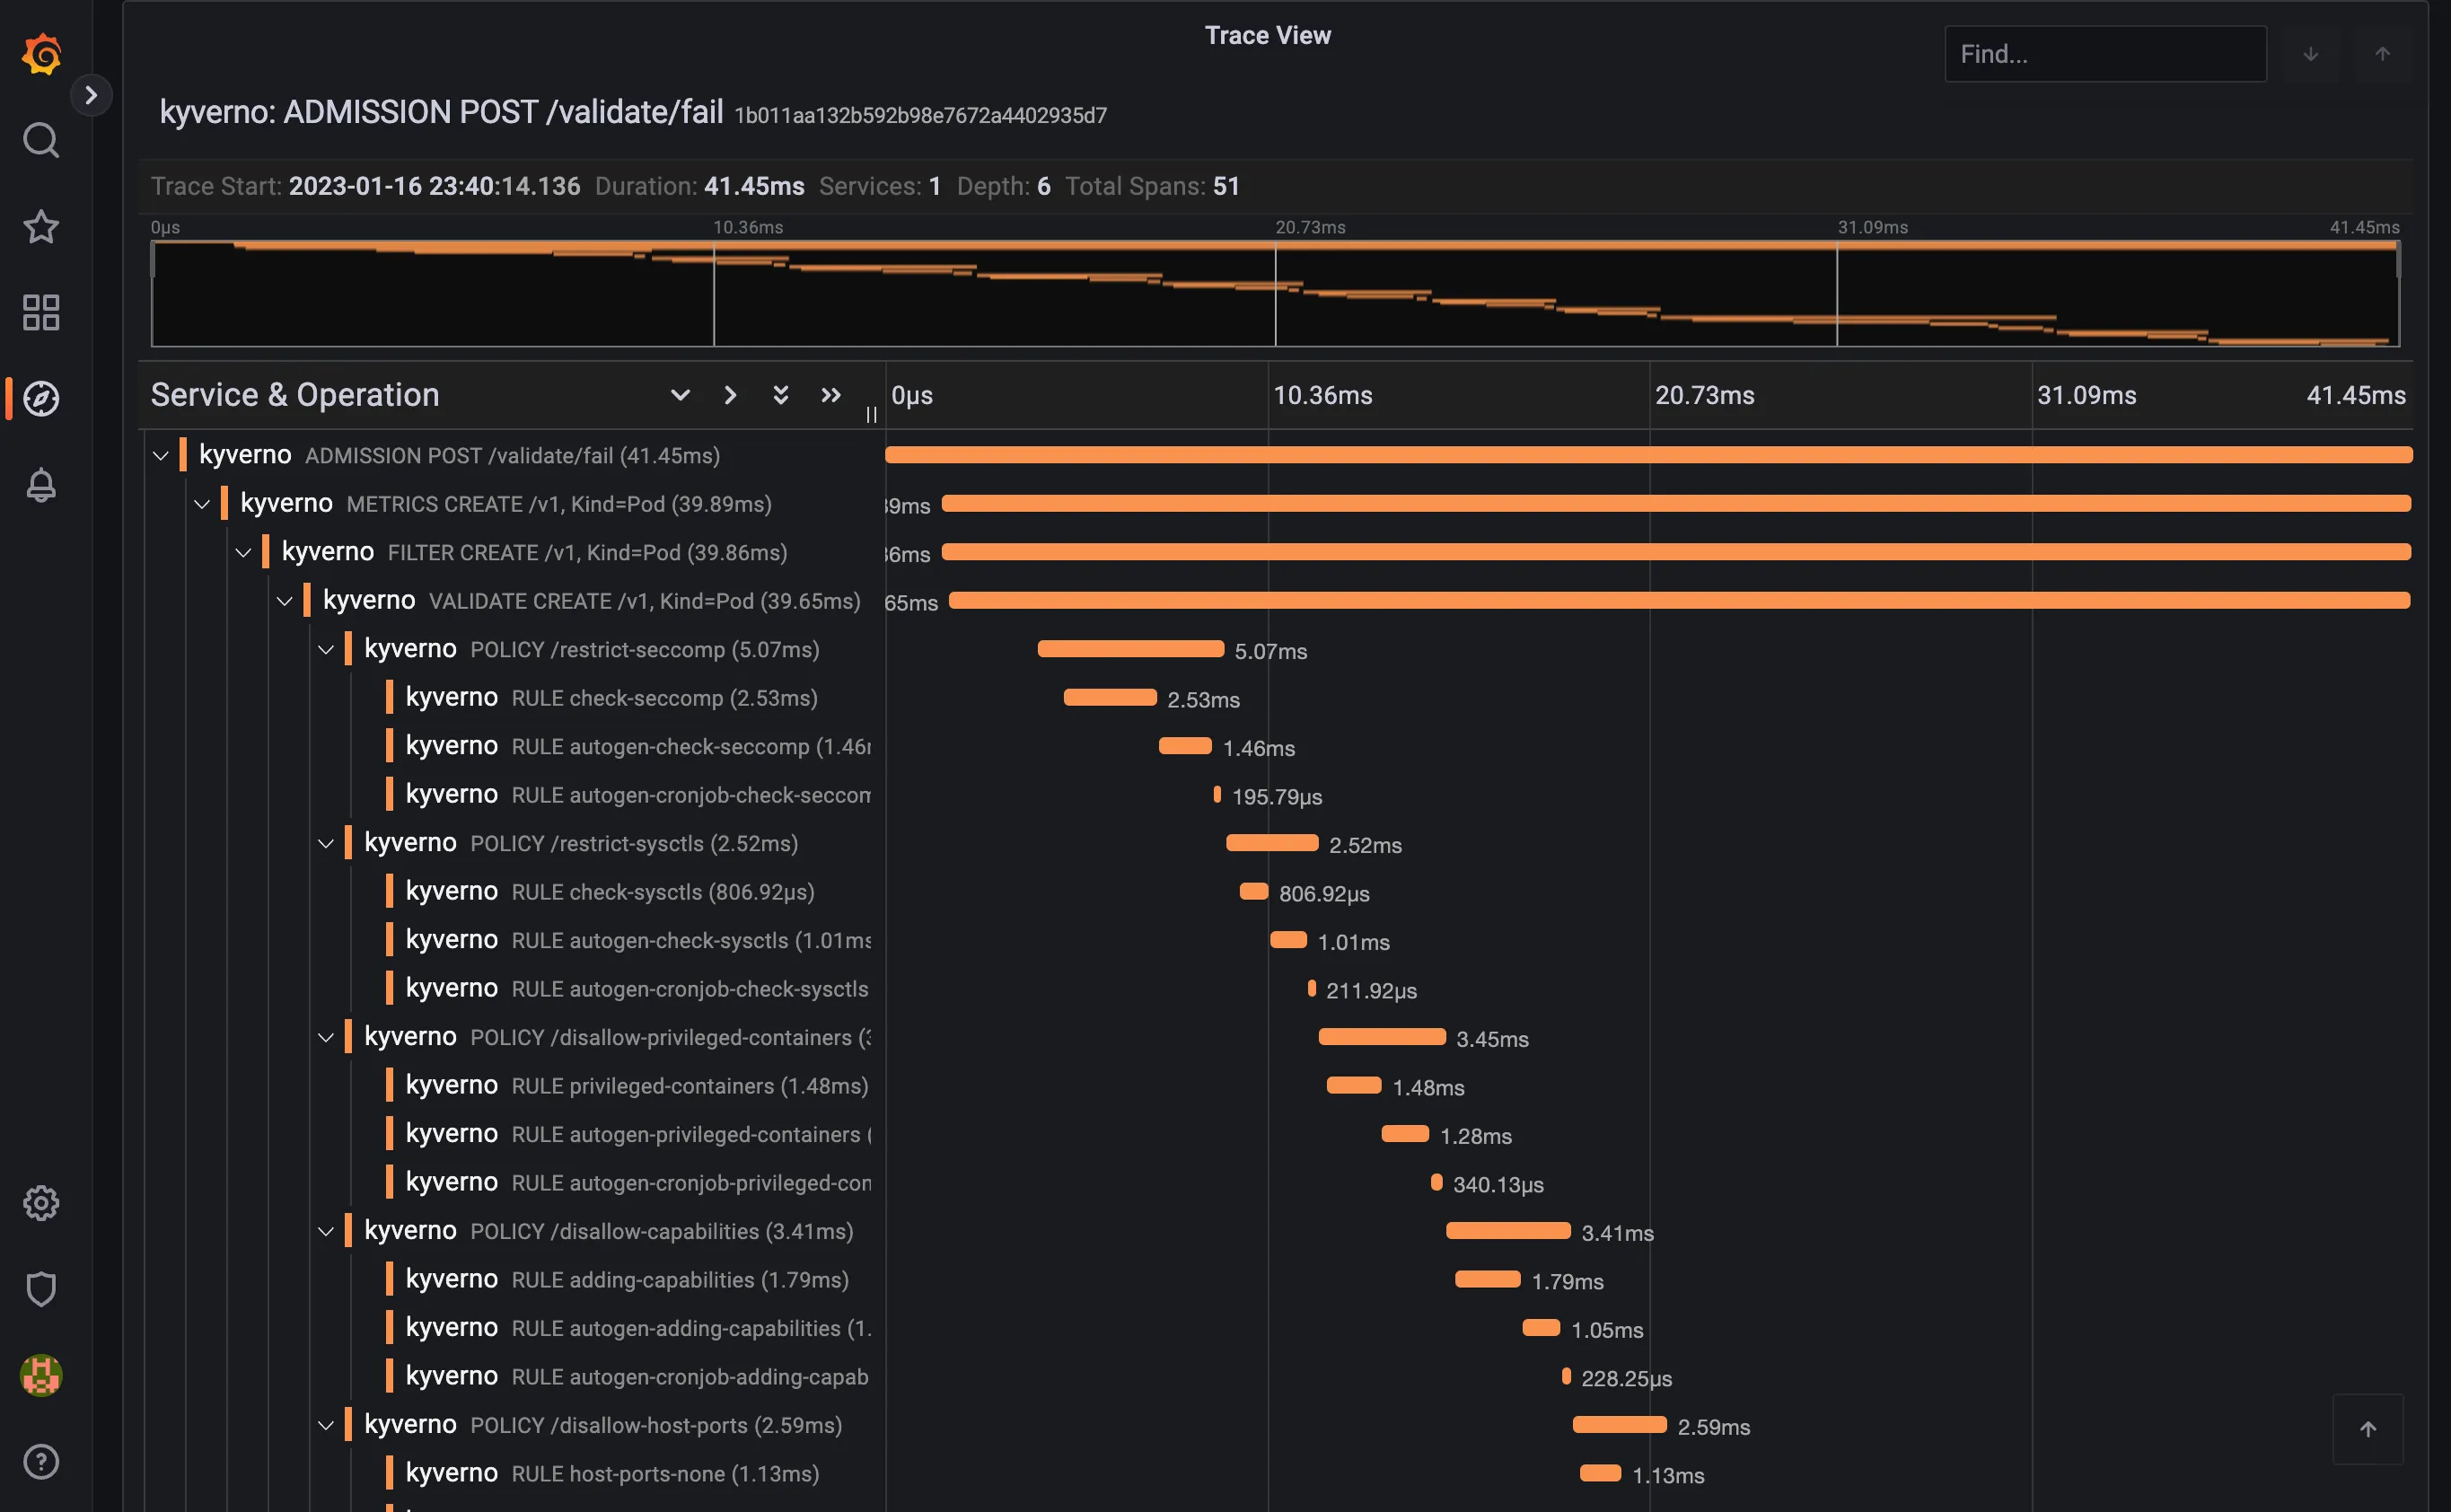
Clicking on the trace will take you to the trace details, showing all spans covered by the Pod admission request:
The trace shows individual spans of all the policies that were just installed, with child spans for every rule that was checked (but not necessarily evaluated). The sum of all spans equals the trace time or the entire time Kyverno spent processing the Pod admission request.
Tracing with Grafana Tempo
Section titled “Tracing with Grafana Tempo”This walkthrough shows how to create a local cluster and deploy a number of components, including an ingress-nginx ingress controller, Grafana and the Tempo backend to store traces.
On the prepared cluster we will deploy Kyverno with tracing enabled and a couple of policies.
Finally we will exercise the Kyverno webhooks by creating a Pod, then we will use Grafana to find and examine the corresponding trace.
Please note that this walkthrough uses kind to create a local cluster with a specific label on the control plane node. This is necessary as we are using an ingress-nginx deployment specifically crafted to work with kind. All other components setup should not be kind specific but may require different configuration depending on the target cluster.
Cluster Setup
Section titled “Cluster Setup”In this first step we are going to create a local cluster using kind.
The created cluster will have two nodes, one master node and one worker node. Note that the master node maps host ports 80 and 443 to the container node. If those ports are already in use they can be changed by editing the hostPort stanza in the config manifest below.
To create the local cluster, run the following command:
kind create cluster --config - <<EOFkind: ClusterapiVersion: kind.x-k8s.io/v1alpha4nodes: - role: control-plane kubeadmConfigPatches: - |- kind: InitConfiguration nodeRegistration: kubeletExtraArgs: node-labels: "ingress-ready=true" extraPortMappings: - containerPort: 80 hostPort: 80 protocol: TCP - containerPort: 443 hostPort: 443 protocol: TCP - role: workerEOFIngress NGINX Setup
Section titled “Ingress NGINX Setup”In order to access Grafana from our browser, we need to deploy an ingress controller.
We are going to install ingress-nginx with the following command:
kubectl apply -f https://raw.githubusercontent.com/kubernetes/ingress-nginx/main/deploy/static/provider/kind/deploy.yamlsleep 15kubectl wait --namespace ingress-nginx --for=condition=ready pod --selector=app.kubernetes.io/component=controller --timeout=90sGrafana Setup
Section titled “Grafana Setup”Grafana will allow us to explore, search and examine traces.
We can deploy Grafana using Helm with the following command:
helm install grafana --namespace monitoring --create-namespace --wait \ --repo https://grafana.github.io/helm-charts grafana \ --values - <<EOFadminPassword: adminsidecar: enableUniqueFilenames: true dashboards: enabled: true searchNamespace: ALL provider: foldersFromFilesStructure: true datasources: enabled: true searchNamespace: ALLgrafana.ini: server: root_url: "%(protocol)s://%(domain)s:%(http_port)s/grafana" serve_from_sub_path: trueingress: enabled: true path: /grafana hosts: []EOFAt this point Grafana should be available at http://localhost/grafana (log in with admin / admin).
Tempo Setup
Section titled “Tempo Setup”Tempo is a tracing backend capable of receiving traces in OpenTelemetry format. It is developed and maintained by the Grafana team and integrates very well with it.
We can deploy Tempo using Helm with the following command:
helm install tempo --namespace monitoring --create-namespace --wait \ --repo https://grafana.github.io/helm-charts tempo \ --values - <<EOFtempo: searchEnabled: trueEOFTo make Tempo available in Grafana, we need to register it as a Grafana data source:
kubectl apply -f - <<EOFapiVersion: v1kind: ConfigMapmetadata: labels: grafana_datasource: "1" name: tempo-datasource namespace: monitoringdata: tempo-datasource.yaml: |- apiVersion: 1 datasources: - name: Tempo type: tempo access: proxy url: "http://tempo.monitoring:3100" version: 1 isDefault: trueEOFAt this point we have a running cluster with Grafana and Tempo backend installed and we can access Grafana using an ingress controller.
Kyverno Setup
Section titled “Kyverno Setup”We now need to install Kyverno with tracing enabled and pointing to our Tempo backend.
We can deploy Kyverno using Helm with the following command:
helm install kyverno --namespace kyverno --create-namespace --wait \  --repo https://kyverno.github.io/kyverno kyverno \  --values - <<EOFadmissionController:  tracing:    # enable tracing    enabled: true    # tempo backend url    address: tempo.monitoring    # tempo backend port for opentelemetry traces    port: 4317
backgroundController:  tracing:    # enable tracing    enabled: true    # tempo backend url    address: tempo.monitoring    # tempo backend port for opentelemetry traces    port: 4317
cleanupController:  tracing:    # enable tracing    enabled: true    # tempo backend url    address: tempo.monitoring    # tempo backend port for opentelemetry traces    port: 4317
reportsController:  tracing:    # enable tracing    enabled: true    # tempo backend url    address: tempo.monitoring    # tempo backend port for opentelemetry traces    port: 4317EOF
Kyverno policies Setup
Section titled “Kyverno policies Setup”Finally we need to deploy some policies in the cluster so that Kyverno can configure admission webhooks accordingly.
We are going to deploy the kyverno-policies Helm chart (with the Baseline profile of PSS) using the following command:
helm install kyverno-policies --namespace kyverno --create-namespace --wait \ --repo https://kyverno.github.io/kyverno kyverno-policies \ --values - <<EOFvalidationFailureAction: EnforceEOFNote that we are setting validationFailureAction to Enforce because Audit-mode policies are processed asynchronously and will produce a separate trace from the main one (both traces are linked together though, but not with a parent/child relationship).
Create a Pod and observe the corresponding trace
Section titled “Create a Pod and observe the corresponding trace”With everything in place we can exercise the Kyverno admission webhooks by creating a Pod and locating the corresponding trace in Grafana.
Run the following command to create a Pod:
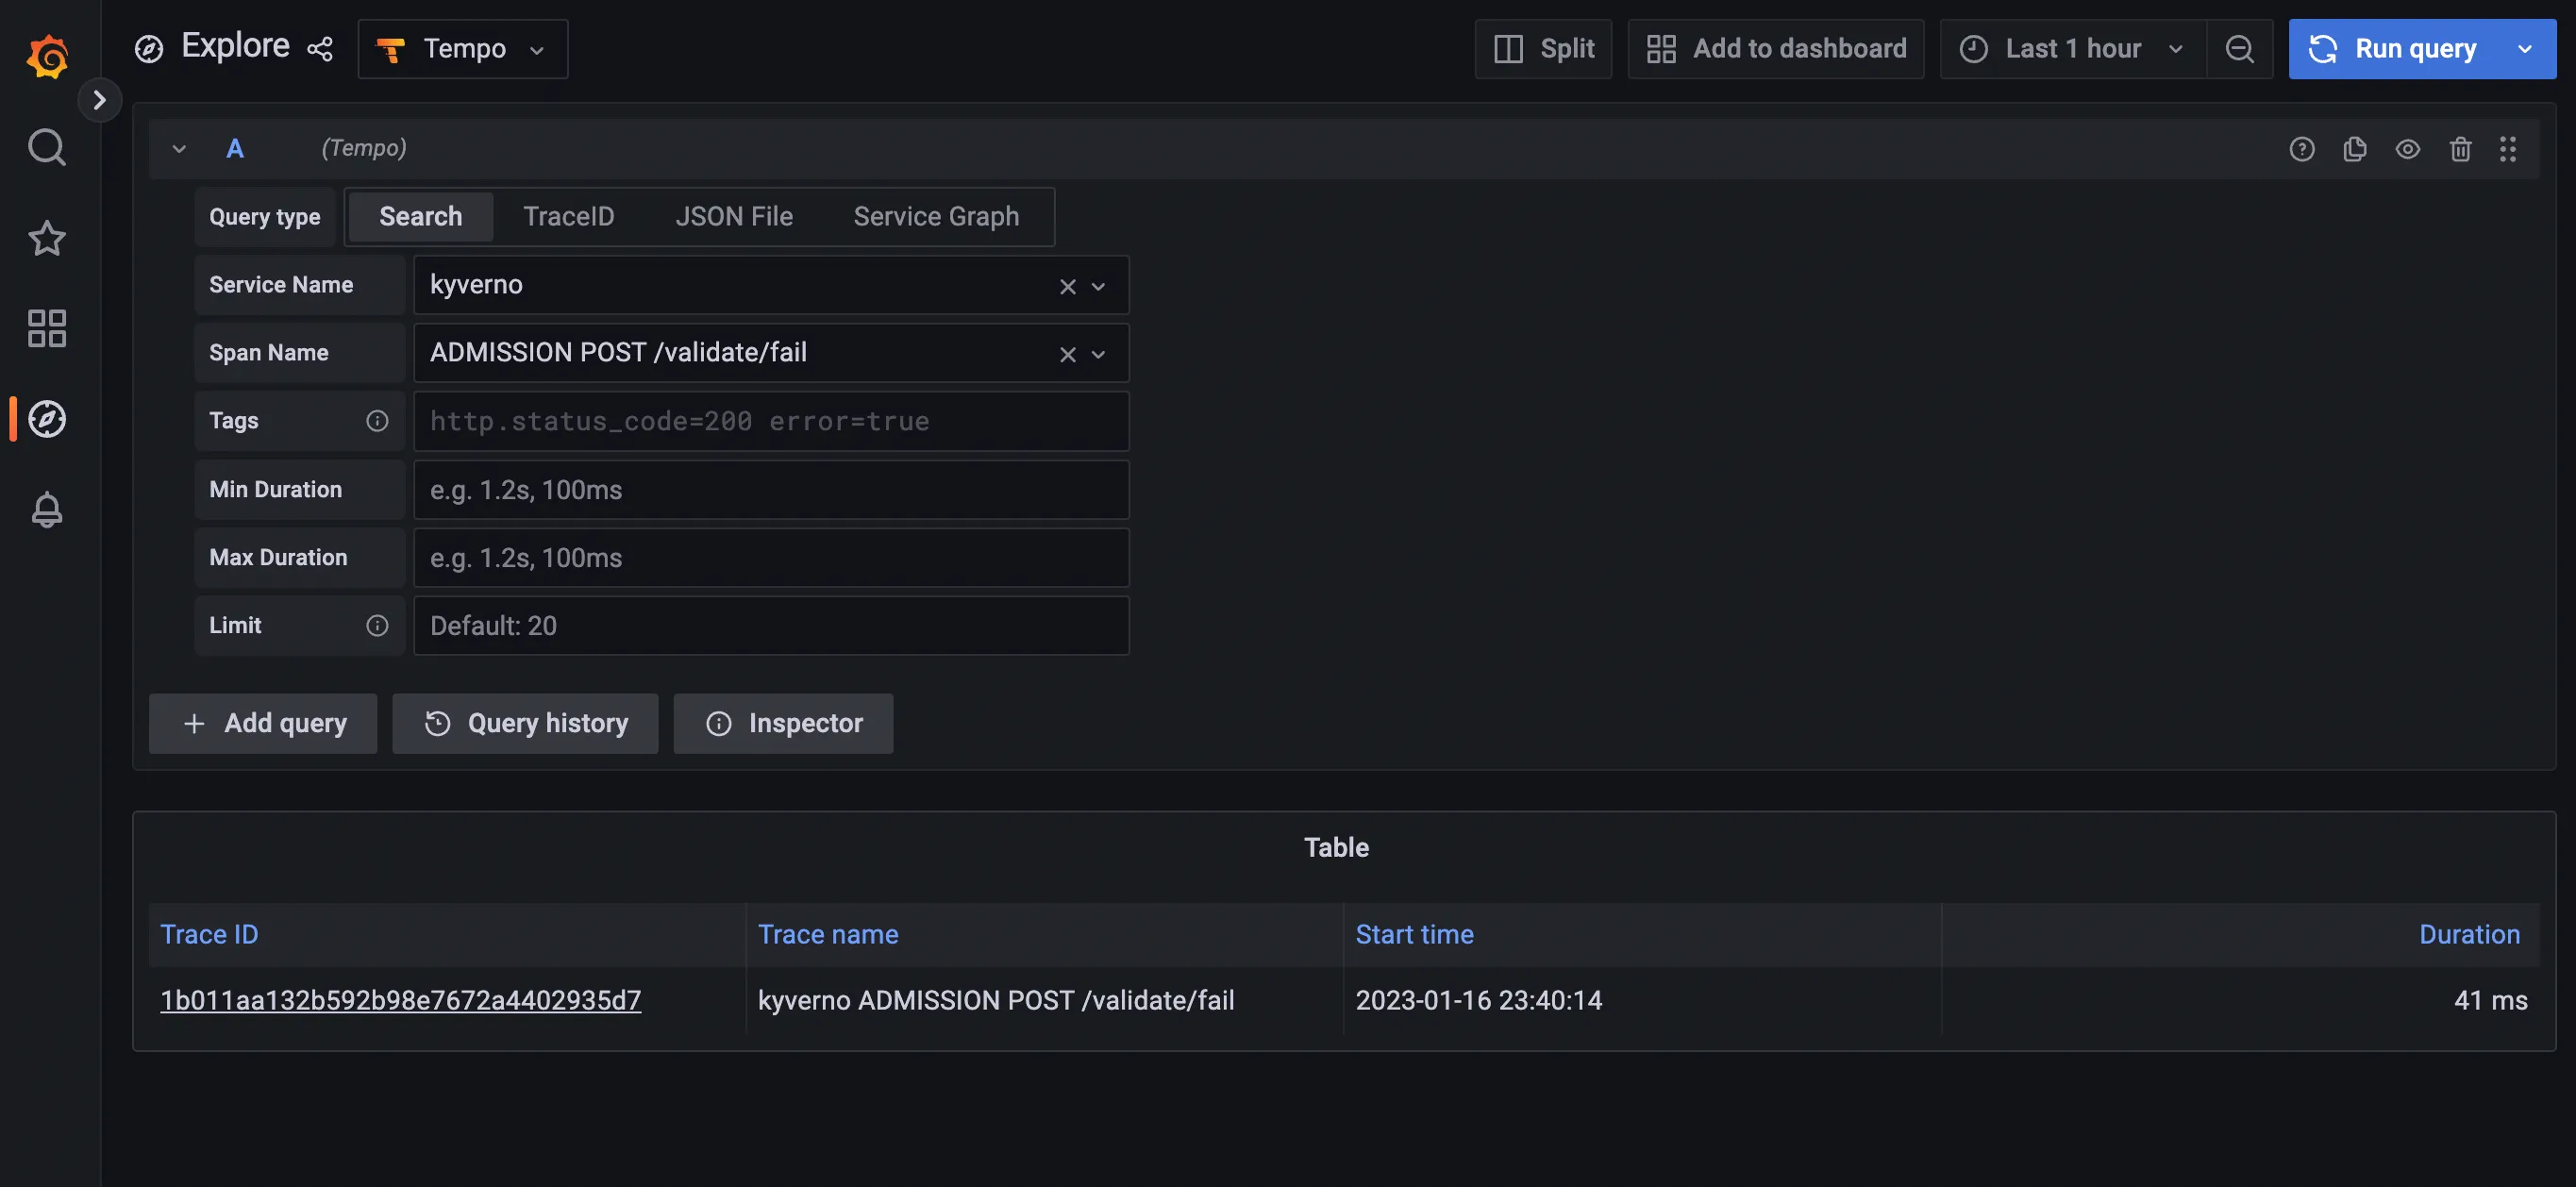
kubectl run nginx --image=nginxAfter that, navigate to the Grafana explore page, select Tempo in the top left drop down list, click on the Search tab, and search for traces with the following criteria:
- Service name:
kyverno, every trace defines a service name and all traces coming from Kyverno will use thekyvernoservice name - Span name:
ADMISSION POST /validate/fail, every span defines a span name and root spans created by Kyverno when receiving an admission request have their name computed from the http operation and path (ADMISSION <HTTP OPERATION> <HTTP PATH>. The/validate/failpath indicates that it’s a validating webhook that was configured to fail the admission request in case of error. Fail mode is the default).
The list should show the trace for the previous Pod creation request:
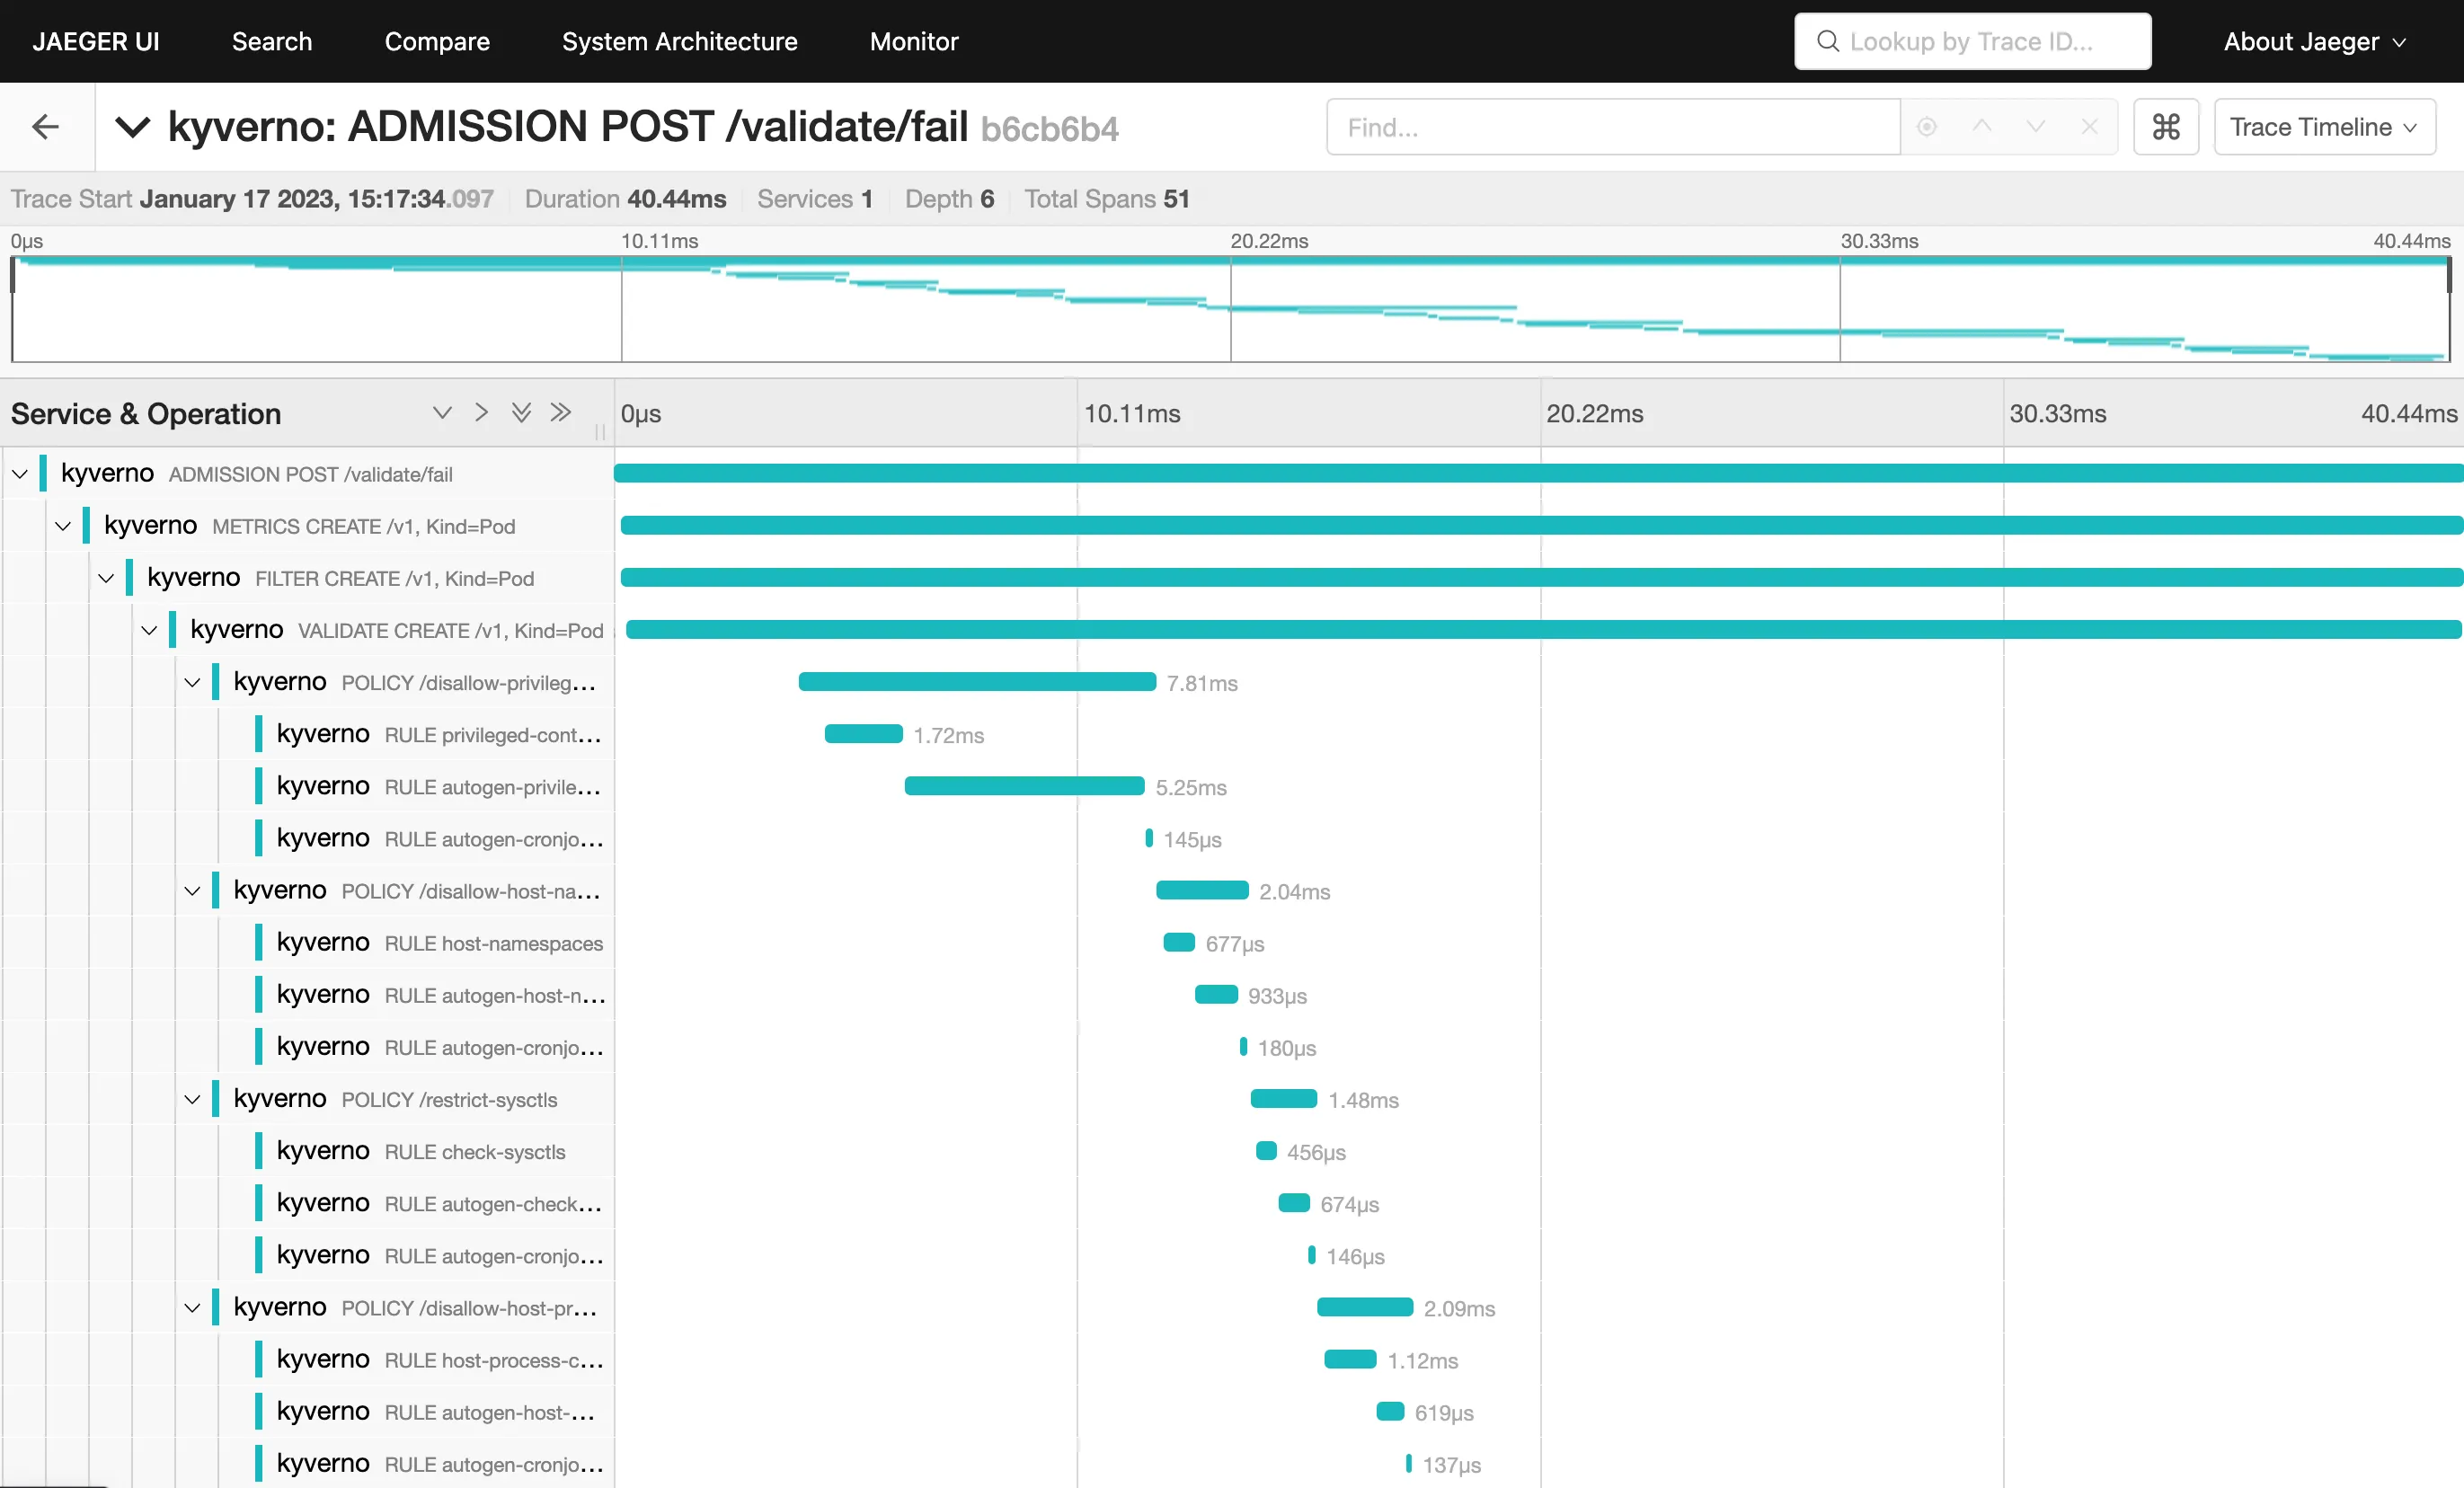
Clicking on the trace will take you to the trace details, showing all spans covered by the Pod admission request:
The trace shows individual spans of all the policies that were just installed, with child spans for every rule that was checked (but not necessarily evaluated). The sum of all spans equals the trace time or the entire time Kyverno spent processing the Pod admission request.